Data Literacy for Educators: How to Read Course Engagement Data
Data literacy now outranks almost every other skill phrase in education search, and for a plain reason: teaching generates more data than ever, and most of it lands on people who were never shown how to read it. Every LMS ships dashboards. Every video platform counts views. Every AI feature produces a report. The gap is not access to numbers, it is the judgment to know which numbers mean something, which are noise, and which are quietly lying. This guide is data literacy for educators in practical form: five skills that turn course data from wallpaper into decisions.
Skill 1: Know what each metric can and cannot say
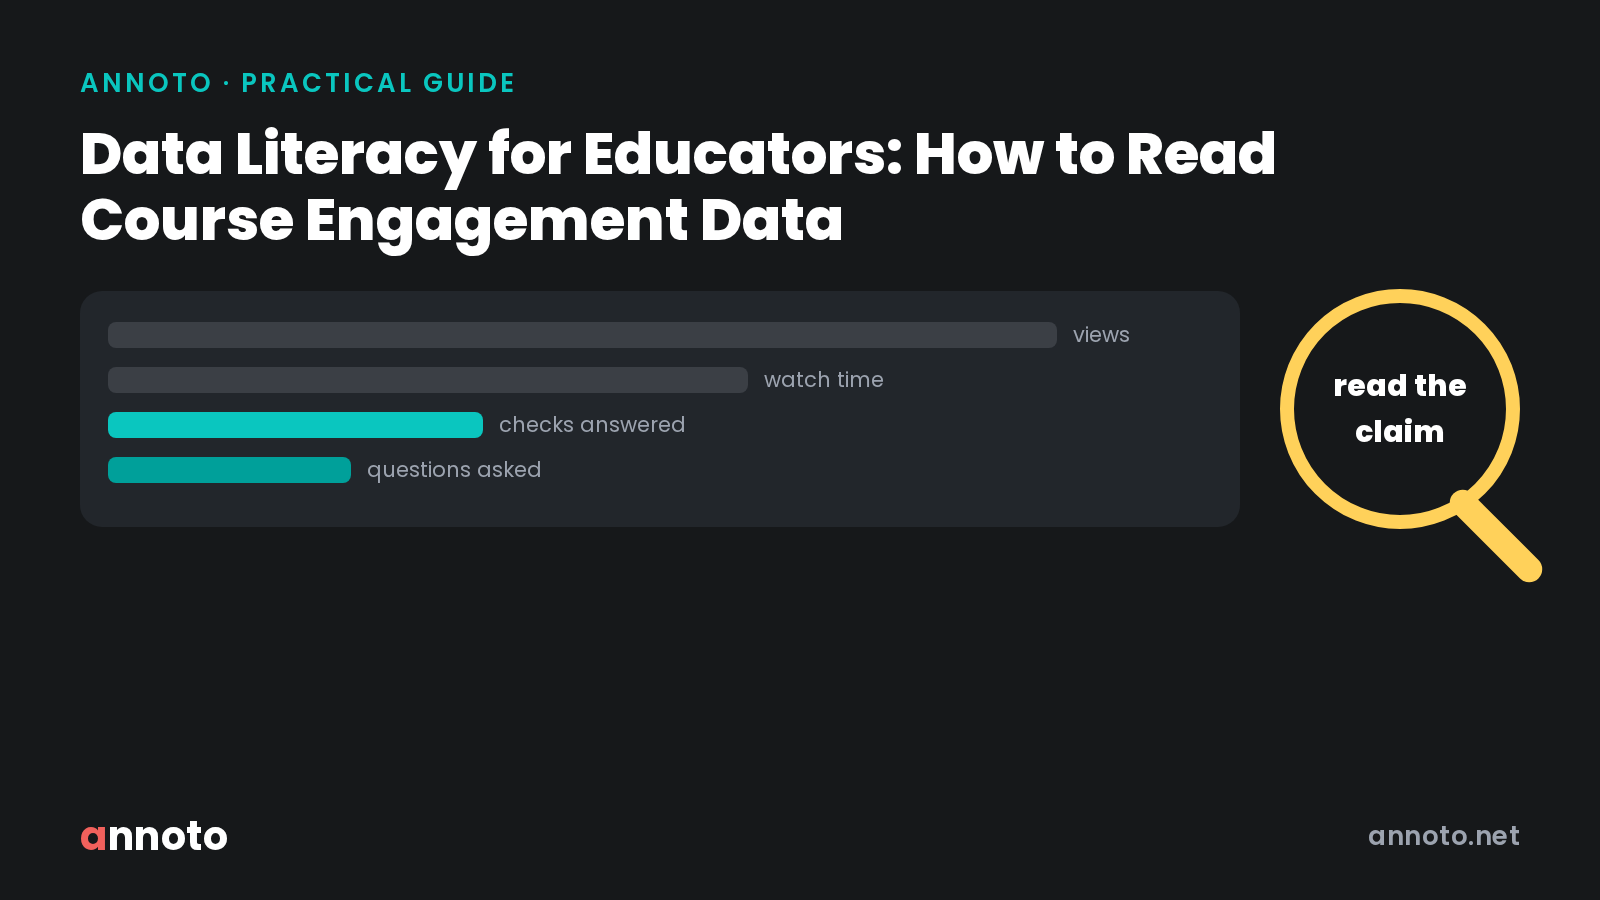
A view count says a file was opened. It does not say anyone watched, and it certainly does not say anyone understood. Completion percentage says the player reached the end, which a second tab achieves as well as attention does. The first move of a data literate educator is sorting metrics by the strength of their claim: presence metrics (views, logins), persistence metrics (watch time, completion), and participation metrics (questions asked, checks answered, comments posted). Our video engagement analytics 101 walks the full ladder, and the rule of thumb is simple: never make a decision on a presence metric that a participation metric could contradict.
Skill 2: Separate compliance signals from learning signals
Two students can both sit at 78% completion while being in opposite situations: one coasting on silent compliance, one watching less but asking fourteen questions and answering nine classmates. Dashboards average these students into the same row. Reading them apart requires looking at what students do while watching, not whether they watched, a distinction we unpack in how to know if students actually watched the video. When engagement is worth grading, it should also flow back into the gradebook automatically rather than through Sunday night spreadsheet matching, which is what gradebook sync exists for.
Skill 3: Read trends, not snapshots
A single week of low engagement is a data point. Three weeks of decline is a story. The most valuable patterns in course data are directional: replays clustering on one segment (a concept is landing badly), a cohort's watch time sliding week over week (drift has started), questions drying up after an exam (confidence or surrender, go find out which). Baselines matter too: comparing this cohort to last year's same week beats comparing it to an imaginary ideal. The maturity curve from counting views to reading trajectories is mapped in our learning analytics maturity model.
Skill 4: Act early and act small
Data literacy is not a reporting skill, it is an intervention skill. The signals that predict course completion show up in the first two weeks: how far into the first videos students get, whether they attempt embedded questions, whether they ever touch the discussion. We detail them in spotting at risk students before week three. The literate response is not a formal escalation, it is a two minute personal message sent while the outcome can still change. Waiting for midterm grades to confirm what week two data already showed is the most common data literacy failure in higher education, and the most expensive.
Skill 5: Handle the ethics like a professional
Engagement data describes learning behavior, which makes it sensitive by nature. The professional habits: use data to prompt support, never to ambush; prefer aggregate views for course decisions and individual views only with a support purpose; be transparent with students about what is collected and why; and know your obligations before piping any student data into AI tools, which we cover in AI in the classroom and FERPA. Surveillance framing kills the trust that makes intervention work. Support framing builds it.
Where AI fits
Generative AI is making course data more readable: summaries of discussion threads, natural language queries over analytics, drafted outreach messages. It is also making data literacy more necessary, because AI summaries inherit every limitation of the metrics underneath them. An AI that confidently reports "strong engagement" on the strength of view counts is fluent nonsense. The educator who knows what each metric can claim remains the quality control.
Practical takeaways
Audit your dashboard once: for each number, write down the decision it could change. Delete the ones with no answer from your attention. Pick one participation metric to watch weekly alongside completion. Set a personal rule for week two outreach and automate what the gradebook should know by itself. Data literacy for educators is not statistics training. It is the craft of letting evidence, rather than hope, decide where your limited attention goes.