See exactly where learning happens — and where it breaks down
Participation, completion, watch-time, and comprehension for every learner and every moment. The proof that your video is actually working.
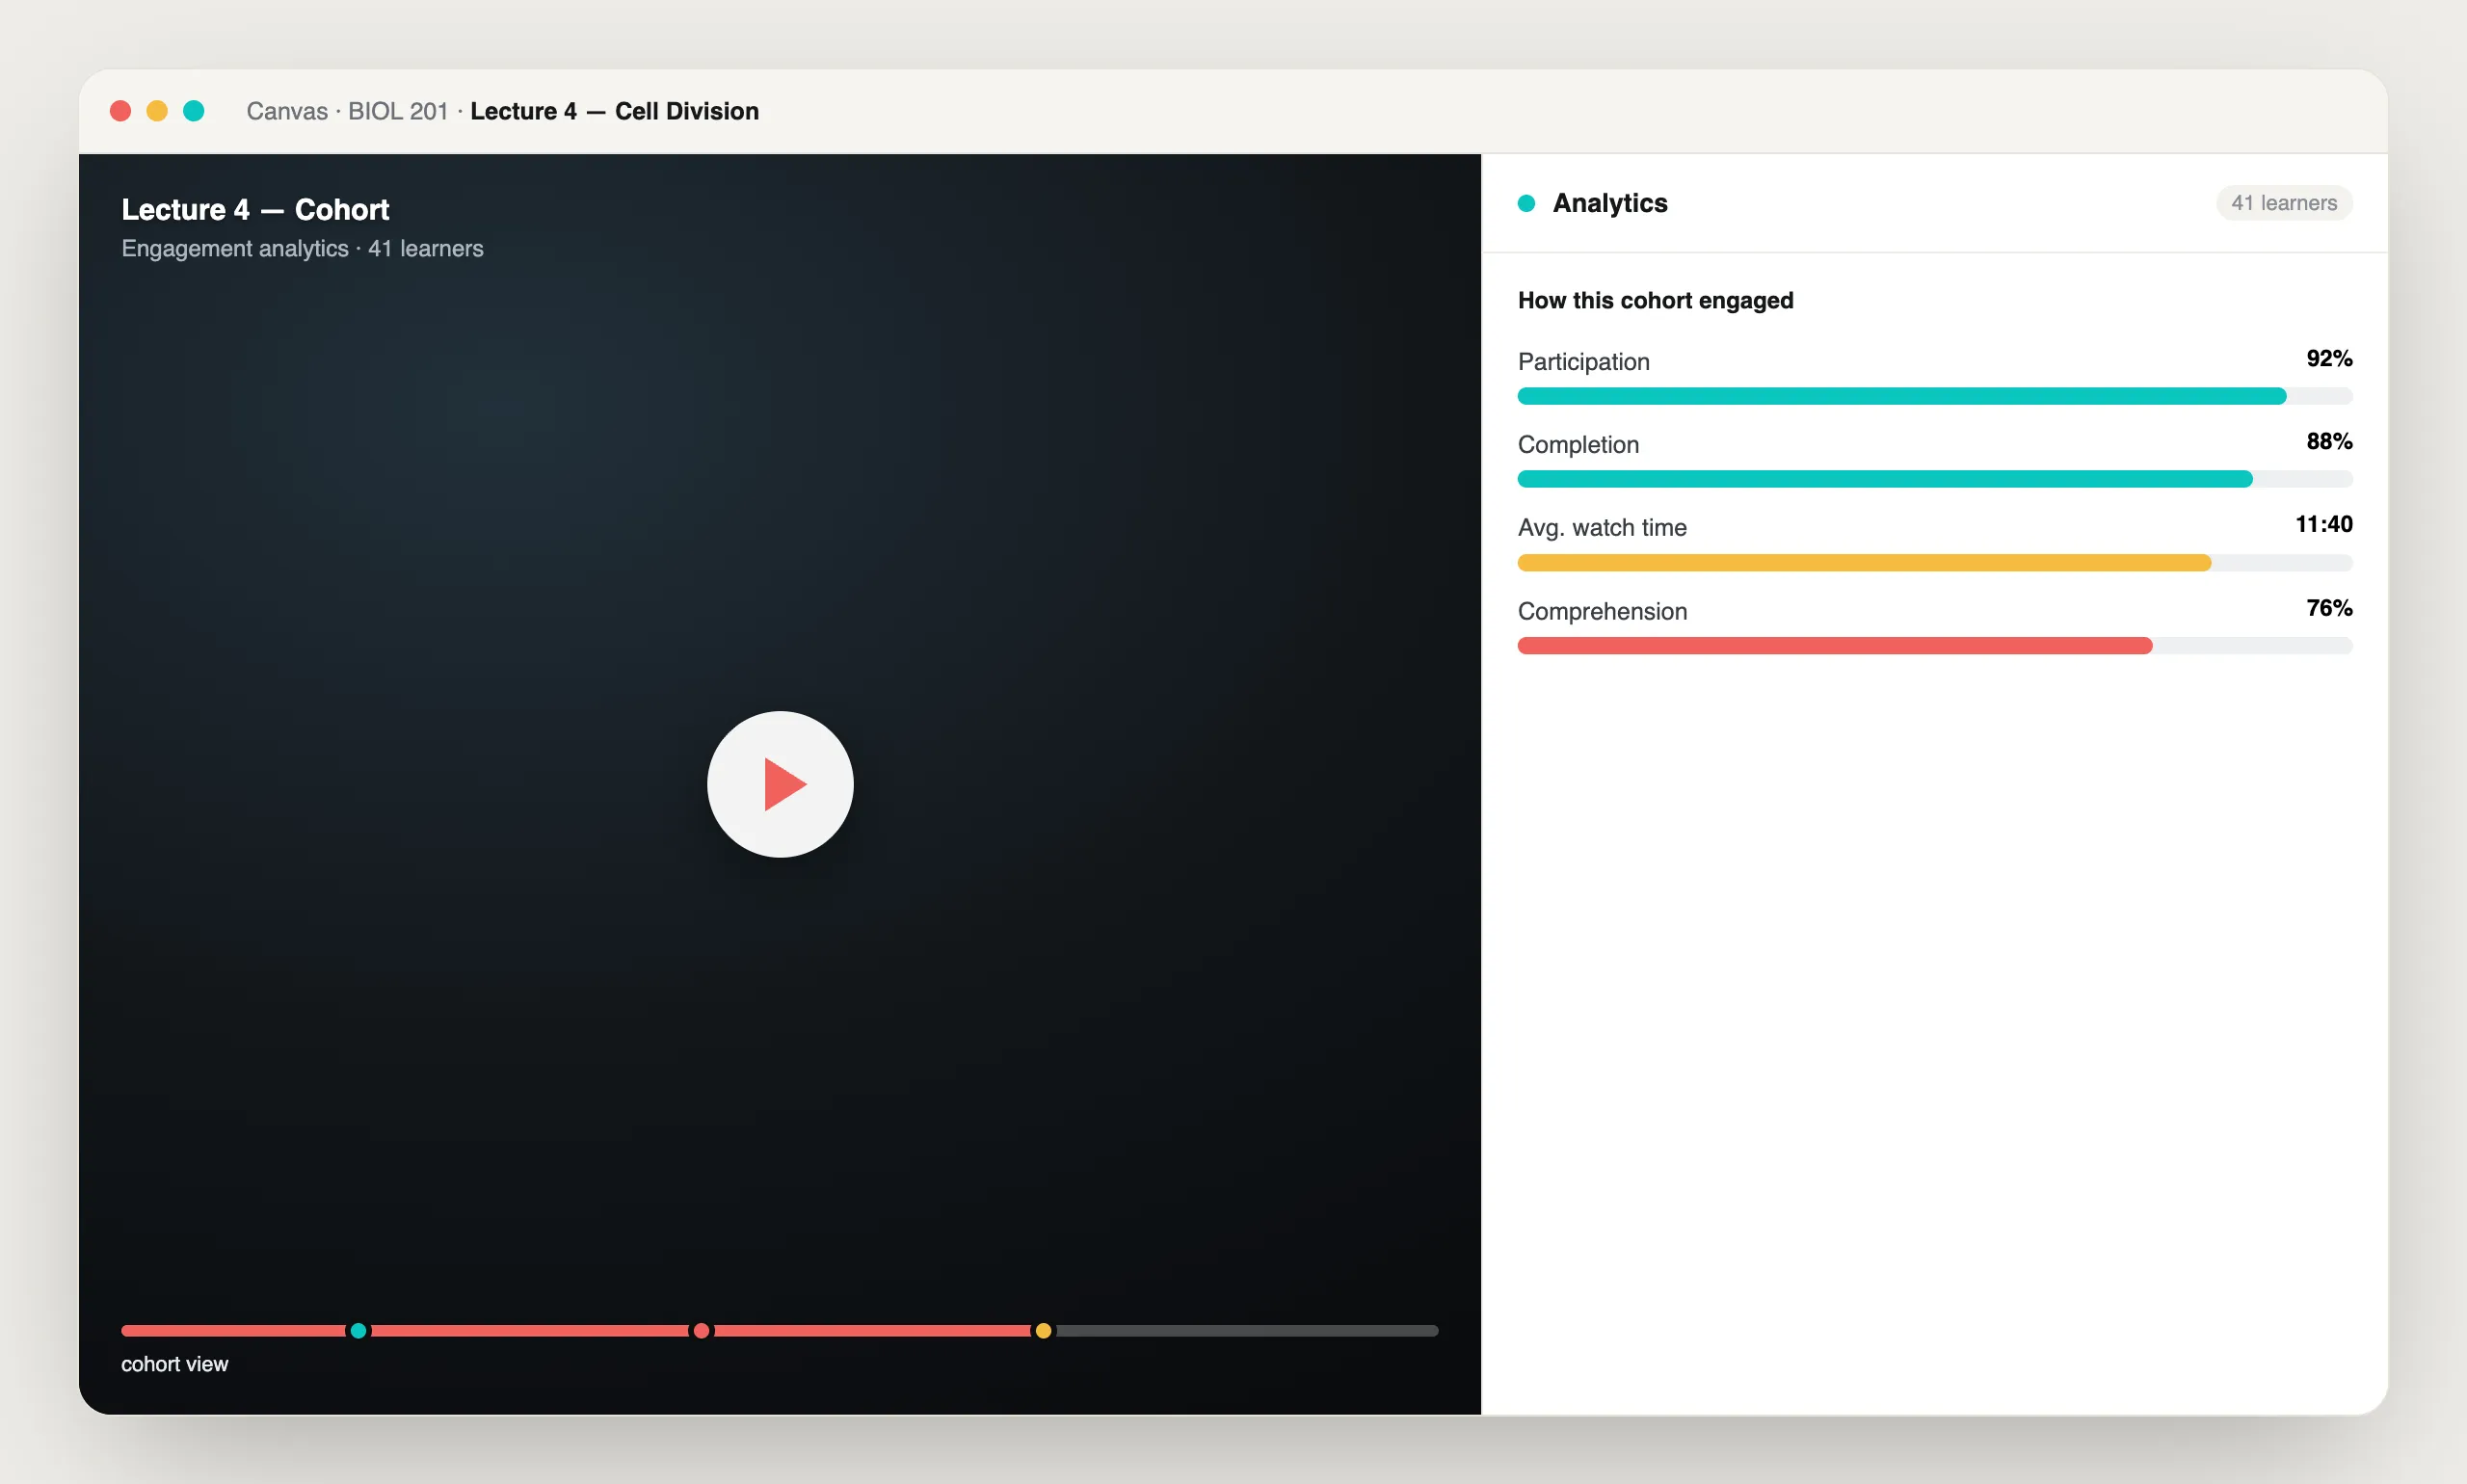
Learn more: What Annoto analytics actually measures
What Annoto Analytics Actually Measures
Most video platforms count plays. Annoto's analytics look inside the viewing session: which segments learners watched, where they slowed down, rewatched, or dropped off, and where they commented, answered a question, or reacted. The result is a per-video and per-learner picture of engagement that instructors can act on during the semester rather than after it ends.
From play counts to learning behavior
Annoto runs as a layer on top of your existing player, including Kaltura, Panopto, Wistia, YouTube, and Vimeo, and observes viewing behavior throughout the session. It then combines that watch data with participation: time-anchored comments and replies, poll votes, quiz answers, and notes. Dashboards appear inside Canvas, Moodle, Blackboard, Brightspace, and Open edX through LTI 1.3, so instructors review engagement without leaving the course, and every metric stays connected to the specific moment in the video that produced it.
Where analytics fits in teaching
A quick weekly review answers practical questions. Segments that are rewatched repeatedly often signal confusion worth addressing in the next session. Segments that are skipped suggest pacing or redundancy problems. Learners who have quietly stopped watching can be contacted before an exam, not after. Before class, many instructors scan where questions cluster on the timeline and open the session by addressing them. Instructional designers use the same dashboards to compare formats, testing whether shorter videos, embedded questions, or reflection points change how a cohort actually watches.
From single videos to program decisions
Engagement data becomes more useful as it accumulates. Course-level views show which weeks lose momentum, and cross-course comparisons show which designs sustain it. Completion and gradebook sync turns watching and participation into LMS gradebook entries when you want video work to count, and analytics export delivers the underlying data as CSV or through the API for institutional reporting. Attention and comprehension metrics add a summary layer for anyone who needs the short version.
Annoto's analytics are used by institutions worldwide as the evidence base for the rest of the platform: discussions, quizzes, polls, and reflection points all feed the same dashboards. Documentation, metric definitions, and LMS setup guides are available at docs.annoto.net.
Reading attention and comprehension together
Attention and comprehension answer different questions, and the gap between them is where the insight lives. Attention reflects how much of a video a learner actually covered and how continuously they watched it; comprehension draws on what learners did along the way, including answers to in-video questions, poll responses, and contributions at reflection points. A cohort showing high attention but weak comprehension is watching dutifully without processing, which usually argues for more embedded questions or a slower treatment of the hardest segment. The reverse pattern, confident answers from learners who skim, often means the video is longer than the material requires.
Decide what completion means before you grade it
When watching counts toward a grade, define completion before the term begins rather than after the first dispute. A course can treat completion as a watch-percentage threshold, as answering the embedded questions, or as a combination of the two, and gradebook sync writes the result back to the LMS automatically over LTI. Three habits prevent most grading friction: publish the rule in the syllabus, keep it identical across every video in the course, and spot-check the first week's passback against the dashboard so discrepancies surface while they are still easy to correct.
A review routine that survives the semester
Instructors who get the most from the dashboards treat them as a recurring calendar entry, not a report to compile. Ten minutes before each teaching week is enough: scan drop-off on the videos just assigned, open the two or three moments with the heaviest rewatching or the densest cluster of questions, and note which learners have gone quiet since the last check. Interventions stay deliberately small: a clarifying reply pinned at the confusing timestamp, a short follow-up poll, a personal message to three students instead of an announcement to three hundred.
At the end of term, run one export and archive it. A CSV of watch and participation data per video gives next year's course revision an evidence base, and repeating the export each term builds the longitudinal picture that program reviews and accreditation self-studies keep asking for.
Built for how people actually learn
From video to active learning in three steps
Numbers that hold up

“What I enjoy most about Annoto is its ease of use for both teachers and students, while serving as an incredibly effective learning tool.”
Engagement Analytics, answered
What can I measure?
Can I spot at-risk students early?
Does it export?
Is it per moment?
Does it respect privacy?
See it on your own course video
Book a 20-minute demo and watch engagement analytics work inside your LMS, on your own content.