Closing the Skills Gap: Video Training Corporate L&D Can Actually Measure
Ask most learning and development teams how a training program is performing and you'll hear a completion rate. Ninety-four percent finished the module. It sounds like success, but it answers the wrong question. Completion tells you someone reached the end of a video. It says nothing about whether they understood it, could apply it, or changed how they work. In a tight labor market where the skills gap is a business risk, that distinction matters.
The completion trap
Completion checkboxes became the default because they are easy to capture, not because they mean anything. A learner can leave a video playing in a background tab and still count as complete. When compliance and upskilling budgets are justified on those numbers, organizations end up optimizing for attendance instead of capability.
The alternative is to measure understanding at the point of learning, while the content is on screen and the concept is fresh, rather than hoping it shows up months later in performance reviews.
Tie interactions to outcomes
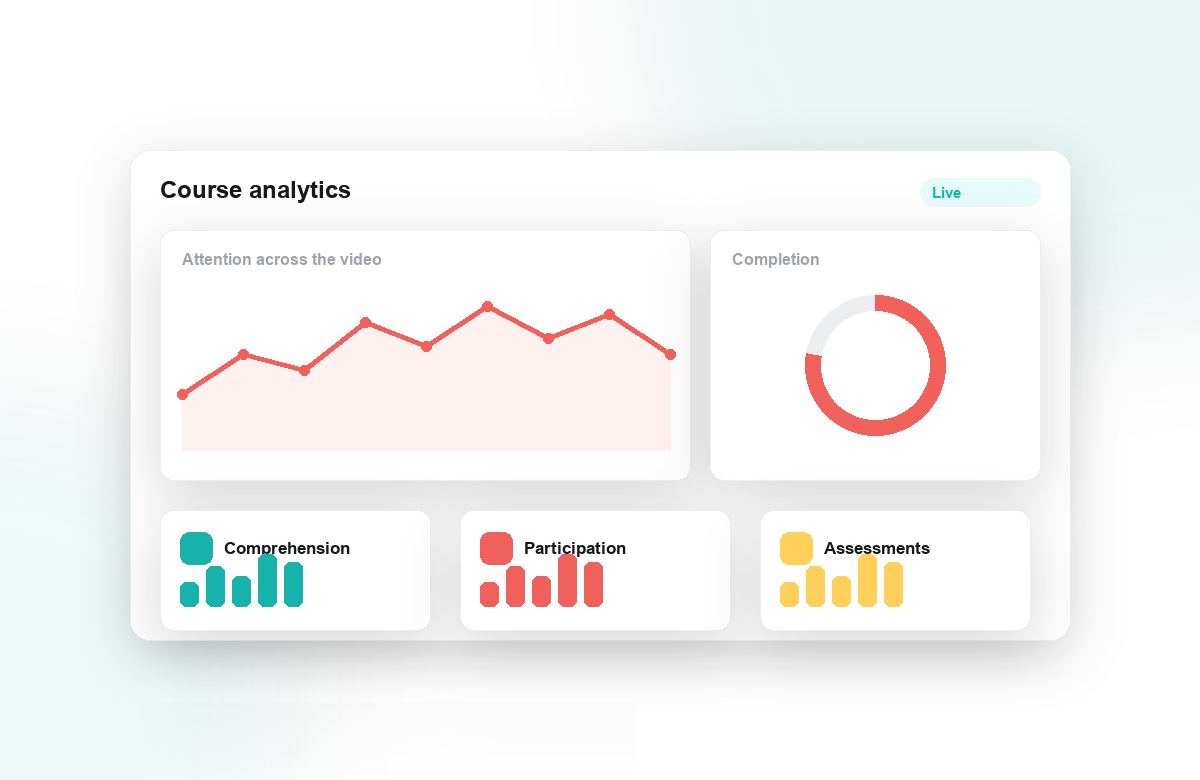
Interactive video makes measurement native. When a learner answers embedded questions, poses their own, and responds to scenario prompts, every one of those interactions is a signal. Aggregate them and you get something completion never gave you: a view of what the cohort actually grasped and where it broke down.
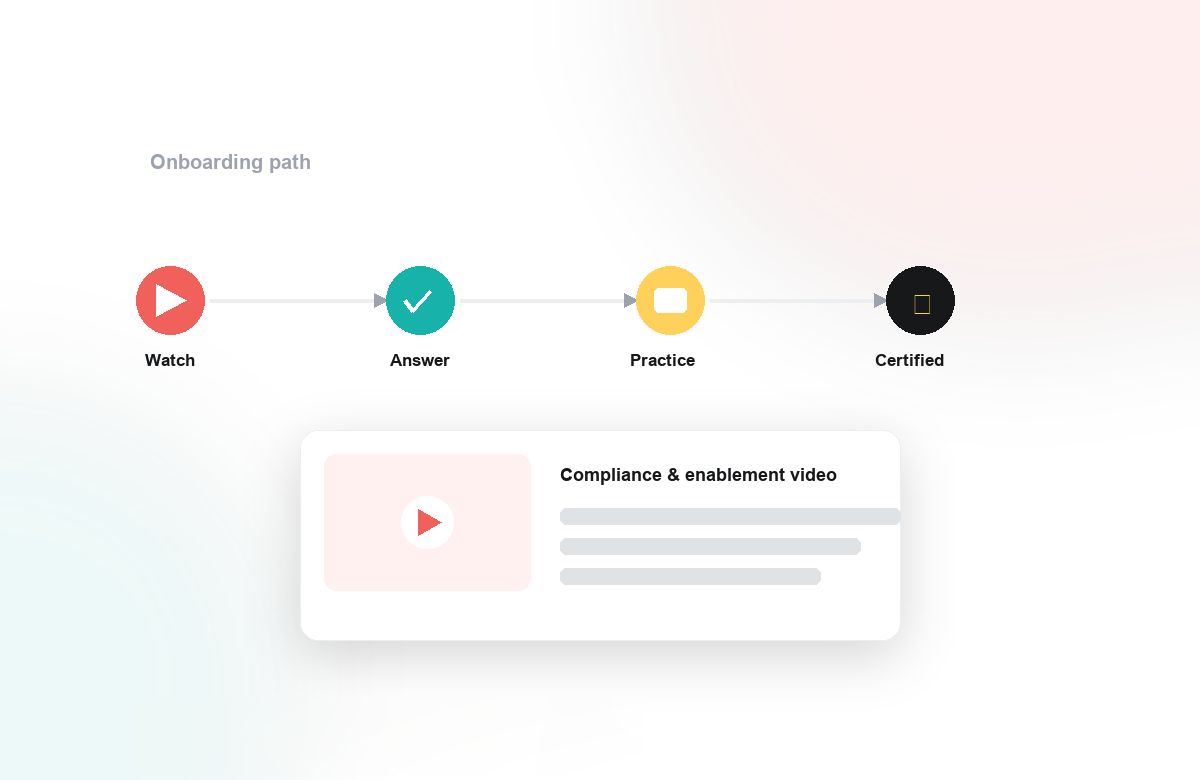
- Onboarding: spot which policies or systems new hires misunderstand before they hit the floor.
- Compliance: demonstrate genuine comprehension, not just a timestamp, for auditable requirements.
- Upskilling: identify the exact concept where a team stalls, and target follow-up precisely.
The shift is from proving that training happened to understanding what it produced. That is the language executives care about, and it turns L&D from a cost center into a source of workforce intelligence.
From data to intervention
Measurement only matters if it drives action. The value of interaction analytics is that they are diagnostic and timely. If a segment of a compliance course consistently confuses people, you rewrite that segment. If a group struggles with a specific product concept during onboarding, you add a live session for exactly that group. The data points to the intervention instead of leaving you guessing.
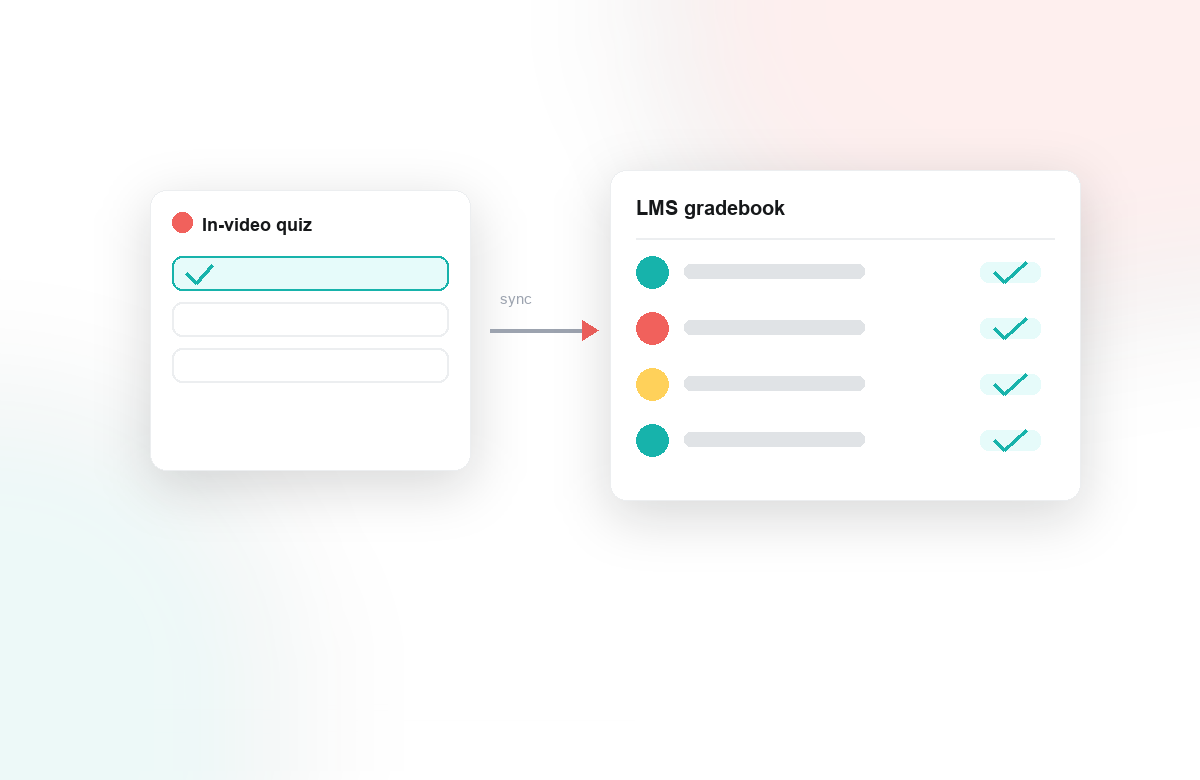
This is where a platform like Annoto fits corporate L&D. In-video questions and discussion capture the signal, analytics turn it into a picture of comprehension across the cohort, and one-click LTI 1.3 integration means it lives inside the LMS your organization already runs rather than adding another disconnected system.
The bottom line
The skills gap will not close because more people watched more videos. It closes when training is designed to be measured, when interaction data tells you what stuck, and when that insight loops back into better content and targeted support. Stop reporting on completion. Start reporting on understanding, and let the difference show up where it counts: in what your people can actually do.
Getting started this quarter
Making the shift does not require rebuilding your curriculum. Choose one program with clear stakes, often onboarding for a single role, and define ahead of time what understanding looks like: the three or four decisions a new hire must get right. Embed questions at the moments in each video where those decisions are taught, and let a baseline cohort run through it.
Review the interaction data after the first cohort, not the first quarter. Look for the question most learners miss and the segments where attention fades; fix one of each and run the next group. Because scores and activity sync into your existing LMS records, and results export to CSV or through an API, the reporting your stakeholders receive can improve without a new dashboard.
Within a cycle or two you will have something rare in L&D: an argument for your program grounded in what people demonstrably understood rather than what they sat through, ready before the next budget conversation.
Keep reading
Related: AI in Teaching: What Actually Helps in 2026 (and What's Just Hype), NYU: Saving Time While Engaging Every Student In Active Learning, and RSI Compliance: How to Prove Instructor Interaction in Video Courses.
New to Annoto? Start with What is Annoto?, or see it inside your LMS: Canvas, Moodle, Blackboard, and Brightspace.